
Radar literacy · Field guides · Free to read
Read the sky like a meteorologist.
Weather radar is public data, and it is your data. These guides teach you to read it: what the colors mean, how rotation shows up, and which products forecasters trust when it matters.
35 dBZ heavy rain begins
This is the classic NEXRAD reflectivity scale. Every radar app colors it differently, so learn the numbers. In winter, read it differently again: a 25 dBZ snow band is close to an inch of snow an hour, and the same 25 dBZ as rain is only light rain.
Mammatus at sunset over northeast Nebraska: the underside of a storm's anvil, seen after the radar has already read the rest.
Start here
The fundamentals every radar reader needs.
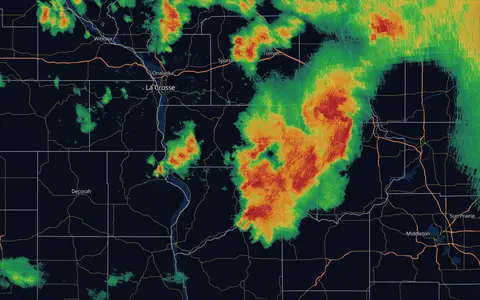
How to Read Weather Radar
What those colors mean, why the scale is logarithmic, and how to read a radar loop like someone who does it for a living.
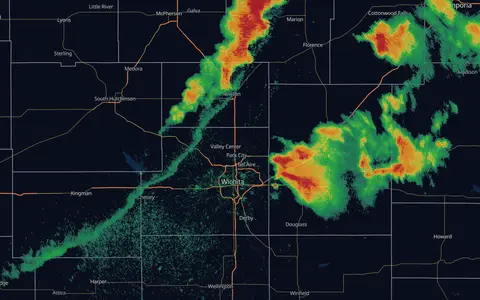
What Radar Can't See
The beam rises, the Earth curves, and half of what confuses people on radar comes down to geometry. Virga, bright banding, ground clutter, and the cone of silence, explained.
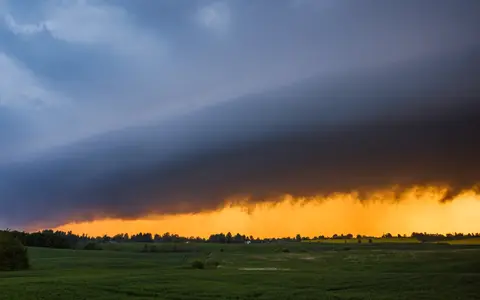
Watches, Warnings & Outlooks
The severe weather alert hierarchy: SPC outlooks days ahead, watches hours ahead, warnings minutes ahead, and what each one should change about your day.
Reading storms
Velocity, rotation, supercells and squall lines.
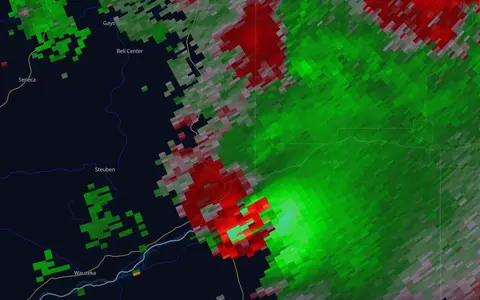
Doppler Velocity, Explained
Green toward, red away, and everything that follows from it. How radar sees wind, what a rotation couplet looks like, and why storm-relative velocity is the product to learn.
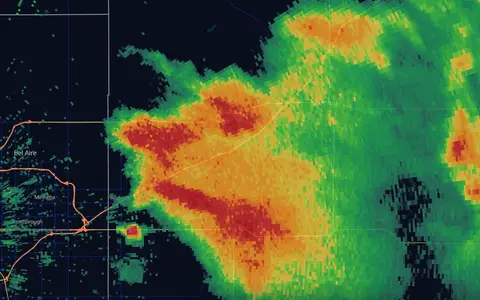
Hook Echoes & Tornado Signatures
What a hook echo looks like on radar, where the tornado sits, why a hook alone proves nothing, and the three signatures forecasters weigh together: the hook, the velocity couplet, and the debris signature.
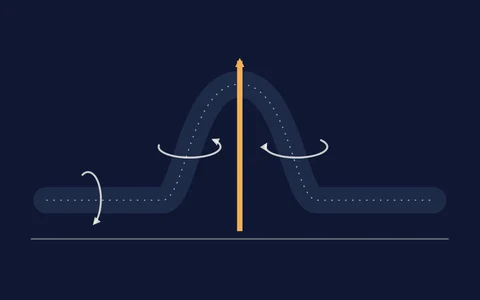
Supercells & Mesocyclones
What makes a thunderstorm a supercell, how wind shear gives its updraft a spin, why storms split into right and left movers, and how a mesocyclone shows up on velocity, on rotation tracks and in the forecast model.
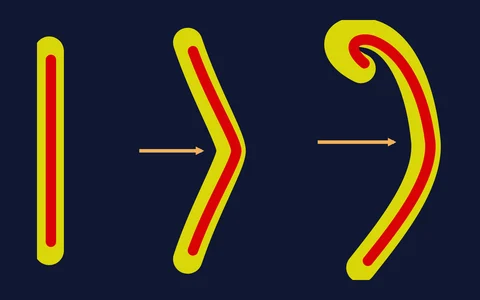
Squall Lines, Bow Echoes & Derechos
How lines of storms make damaging straight-line wind: downbursts and microbursts, the cold pool and rear inflow jet behind a bow echo, where the brief tornadoes in a line form, and what makes a windstorm a derecho.
Storm ingredients
Instability, shear, soundings and hodographs: why storms do what they do.
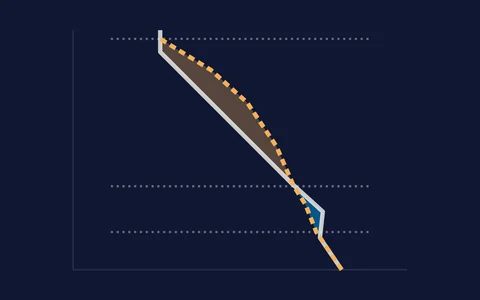
CAPE & Instability, Explained
What CAPE measures, why there are three kinds, how CIN holds storms back, and what cloud base, lapse rates and downdraft CAPE add. The fuel side of every thunderstorm forecast.
Wind Shear & Helicity, Explained
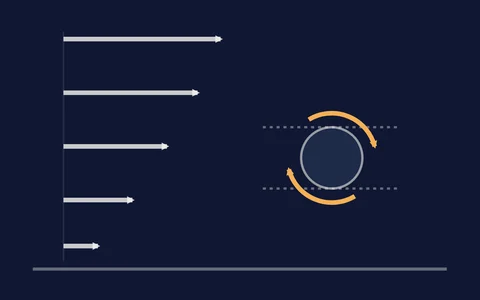
Why winds that change with height turn ordinary storms into long-lived supercells, what bulk shear and storm-relative helicity measure, why the storm's own motion changes the answer, and what the model's updraft helicity tracks.
How to Read a Skew-T
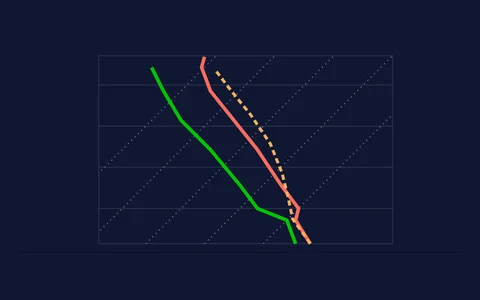
The chart forecasters read before every storm day: what the two lines are, why the temperature lines lean, how to spot the cap, dry air and a melting layer, and where balloon soundings and model soundings differ.
How to Read a Hodograph
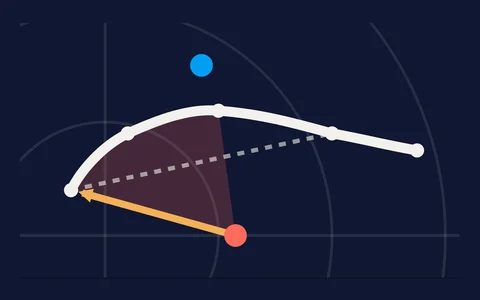
The wind half of a sounding in one curve: what the rings and the trace mean, why a curved hodograph favors right-moving supercells, where the storm's motion sits, and what the critical angle, the 3D view and streamwise vorticity add.
SCP & STP, Explained
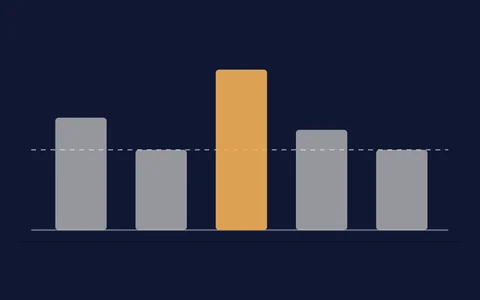
How the Supercell Composite Parameter and the Significant Tornado Parameter are built, what a value of 1 means, why they read zero in the wrong places, and the one assumption both make that is easy to forget. Plus EHI and the hail parameter SHIP.
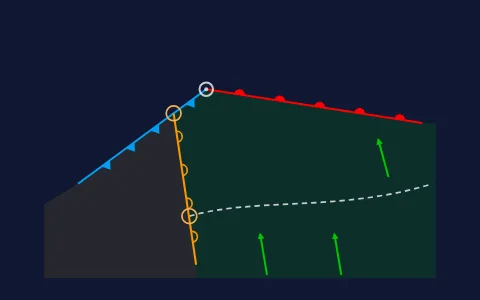
Storm Day, Start to Finish
A morning-to-evening checklist for a severe weather day: the SPC outlook and the morning balloons, finding fronts, drylines and outflow boundaries, judging the cap, then watches, radar and the evening window, with links to the deeper guides.
Hazards
Hail, flooding, lightning, lake-effect snow and hurricanes.
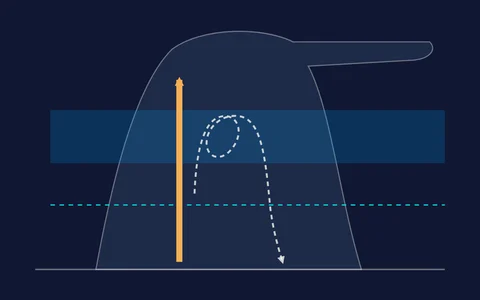
Hail on Radar
How hail grows inside a storm, what size counts as severe, the radar clues that point to big hail (very high reflectivity aloft, dual-pol, the hail spike), and how to read MESH hail swaths without over-reading them.
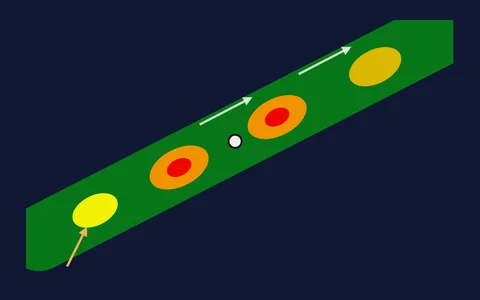
Flash Flooding
Why flash floods are about rain totals and not how scary the radar looks: training and back-building storms, precipitable water, the products that measure how much has fallen, the Excessive Rainfall Outlook, and what the warnings mean.
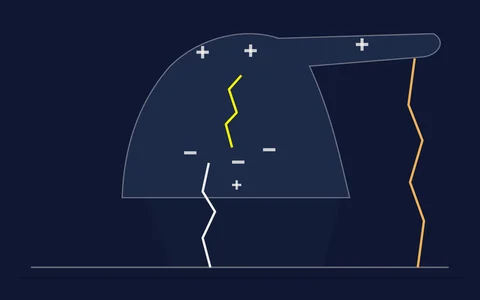
Lightning, Explained
How a thunderstorm builds the charge that becomes lightning, in-cloud versus cloud-to-ground flashes, how satellites map lightning from 22,000 miles up, what a jump in flash rate can mean, and the safety rules that matter.
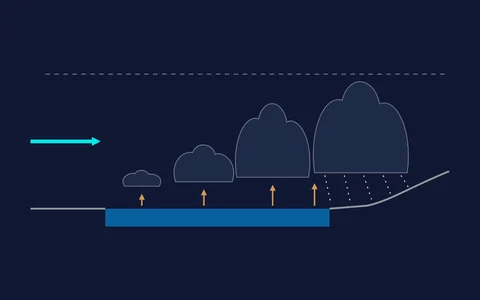
Lake-Effect Snow
How cold air crossing warm, open lake water builds narrow bands of very heavy snow, why a town can get feet while the next one over sees sun, what the wind direction and fetch decide, and why radar often struggles to see the bands.
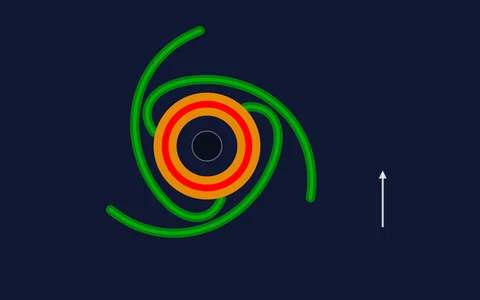
Hurricanes: Structure, the Cone & Model Tracks
The eye, eyewall and rainbands, why the strongest winds sit on one side, what the Saffir-Simpson categories leave out, what the forecast cone really means, and how to read a spaghetti plot of model tracks without being misled.
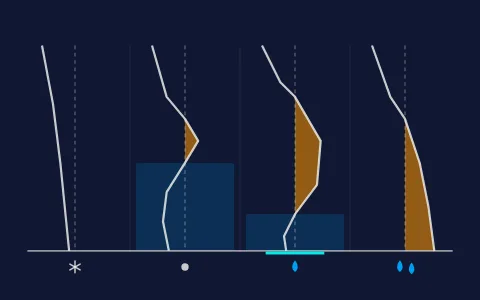
Snow, Sleet & Freezing Rain
How the temperature of the air between the cloud and the ground decides whether winter precipitation lands as snow, sleet, freezing rain or rain, how to spot the rain-snow line on radar, what makes an ice storm, why snow totals depend on the snow-to-liquid ratio, and how to read snow squall warnings and the WPC winter products.
Reading Hail History
What Hail history shows for a place: every date since October 2020 with radar-estimated hail at the location or within 5 miles, the four sizes on each date, why a radar estimate is not a measurement, how the NWS storm reports differ, the 7 AM date window and the dates with no data.
Data & products
Dual-pol, MRMS and satellite: what the pros look at.

Dual-Pol Radar, Explained
ZDR, correlation coefficient, and KDP: the three products that identify what's falling. Hail cores, the melting layer, and the tornado debris signature, decoded with the numbers NWS forecasters use.
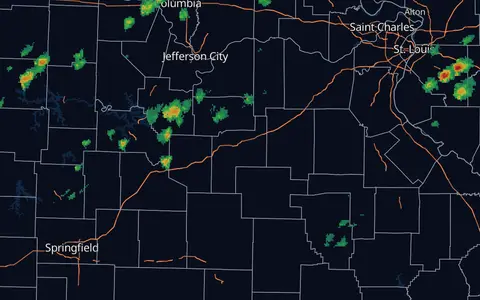
MRMS, Explained
Multi-Radar Multi-Sensor: the NOAA system that merges ~180 radars into one seamless national picture, and the source of rotation tracks, hail estimates, and rainfall totals.
Reading Satellite Colors
The six false-color satellite views (Airmass, Day Cloud Phase, Day Convection, Day Land Cloud Fire, Fire Temperature, Night Microphysics): what each one is for, what its colors mean, and where the colors mislead.
Visible, Infrared & Water Vapor
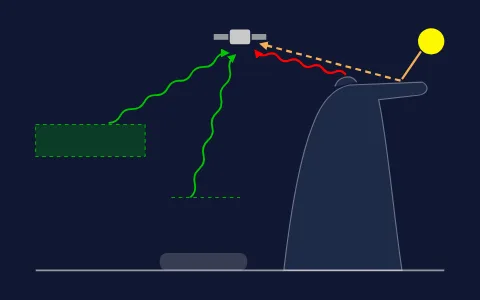
The three single-channel satellite views most weather apps show: what visible, infrared and water vapor each measure, how to read them, and the misreads that trip people up, from colorful infrared read as rain to dark water vapor read as clear sky.