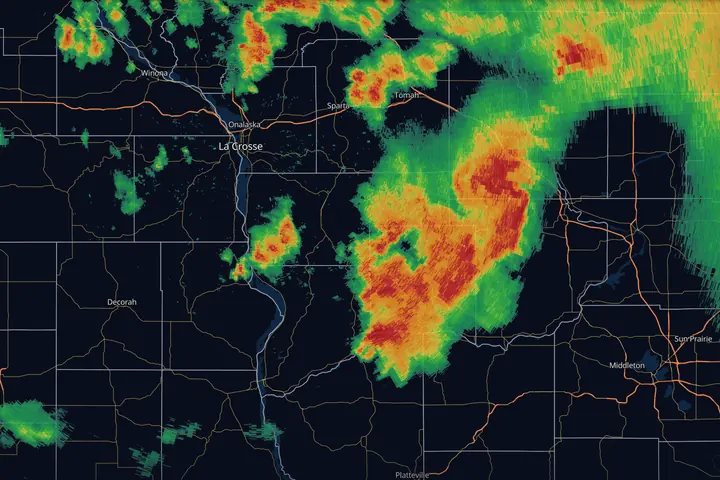
In short: radar colors show how much energy bounced back from rain, snow or hail, measured in dBZ. The scale is logarithmic, so red is not “a bit heavier” than green, it is many times heavier. Read the legend, learn two anchors (about 35 dBZ for heavy rain, 50 and up for strong cores worth checking), and watch the loop rather than one frame.
Weather radar sends out pulses of microwave energy and listens for what bounces back. Big raindrops reflect a lot of energy, drizzle reflects a little, and hail reflects an enormous amount. The radar measures that returned energy and maps it, and that map of reflectivity is what you’re looking at in every radar app.
Learn the unit, the scale, the two reflectivity products, and how to read a loop, and you can read radar in any app on Earth, whatever colors it uses.
The unit: dBZ
Reflectivity is measured in dBZ (decibels of Z, where Z is the reflectivity factor). The key thing to know: the scale is logarithmic. Each 10 dBZ step means roughly ten times more reflected energy.
That’s why the difference between a green blob and a red blob matters so much more than the difference between two shades of green.
What the numbers mean on the ground
| dBZ | Typical meaning (rain) |
|---|---|
| < 15 | Drizzle, haze, bugs, birds. Often nothing reaches the ground |
| 15 to 25 | Light rain |
| 25 to 35 | Moderate rain: steady, wipers on |
| 35 to 45 | Heavy rain, reduced visibility |
| 45 to 55 | Downpour, and where hail starts to be worth checking |
| 55 to 65 | Strong thunderstorm core. Could be hail, could be a tropical downpour: check ZDR |
| 65+ | Extreme core. Almost always hail outside the deep tropics |
Three things the table does not tell you:
- Reflectivity alone does not diagnose hail. No dBZ value confirms hail on its own. In warm, tropical airmasses, 55 to 60 dBZ near the ground is often pure rain. What separates hail from heavy rain is how much strong reflectivity sits above the freezing level, and whether ZDR drops to near zero inside the core. See Dual-Pol Radar, Explained.
- Snow reads low, but not for the reason people assume. An ice particle returns about five times less energy than a water drop of the same size, so a snow band reads a few dBZ below rain of the same liquid rate. The bigger effect is accumulation: snow piles up about ten times deeper than the liquid it came from. A 25 dBZ snow band is roughly a tenth of an inch of liquid an hour, which is close to an inch of snow an hour, and that same 25 dBZ as rain is light rain. In winter, judge a band by what it stacks up rather than by where its color sits on a rain scale.
- Melting snow reads high. Right at the melting layer, snowflakes get coated in liquid water and light up like giant raindrops. This creates the bright band: a ring or stripe of inflated returns that reads far heavier than the precipitation underneath it. More on that in What Radar Can’t See.
Colors are the app’s opinion. Numbers are the truth.
Every app maps dBZ to colors differently. The classic NEXRAD scale runs cyan, blue, green, yellow, orange, red, magenta, purple, then white at the very top, but modern apps (including MesoRadar) offer palettes tuned for contrast, color-blindness, or low-light use.
This is why experienced users read the legend first. “Yellow” means nothing by itself. “48 dBZ” means the same thing everywhere. When you switch apps or palettes, the first thing to do is find the scale and anchor yourself: where does 35 sit? Where does 50 sit? Those are the two thresholds that matter most: 35 is roughly where rain gets serious, 50 is roughly where a core deserves a closer look; whether it is severe depends on how tall it is and what velocity shows.
Base vs. composite reflectivity
Most apps offer two flavors of reflectivity, and they answer different questions:
- Base reflectivity shows one radar tilt, usually the lowest (0.5°). It’s the best answer to “what’s happening near the ground close to the radar?” and it’s the product meteorologists stare at during severe weather, because storm structure (hook echoes, inflow notches) shows up here.
- Composite reflectivity shows the strongest return found in any tilt, at any altitude, in each column. It’s the best answer to “where is the storm’s core, even if it’s suspended aloft?” Hail cores often appear on composite minutes before they descend. The tradeoff: composite smears structure and exaggerates coverage, because a return 30,000 ft up paints the map even if it’s not raining below.
A good habit: track storms on base reflectivity, and glance at composite when you want to know if a storm is hiding something aloft.
How to read a loop
A single radar frame is a photo. A loop is the actual story. When you animate:
- The time on the frame. Check it before anything else. Radar is a few minutes old when it reaches any app, and a paused or stale loop can be much older. A storm moving 50 mph covers four miles in five minutes.
- Direction and speed. Which way are the cells moving, and how fast? A storm 30 miles away moving toward you at 40 mph is a 45-minute problem.
- Trend. Are the cores brightening (strengthening) or fading (weakening)? Is a cluster organizing into a line?
- Training. If cells keep forming and passing over the same spot, like train cars over one crossing, that’s a flash-flood setup even if no single cell is severe. Repetition matters more than intensity.
- New development. Watch the upstream edge. Storms often fire in sequence along a boundary; the map 100 miles southwest of you is the next few hours of your forecast.
In MesoRadar the loop is the playbar under the map; dragging it steps through frames by hand, which is the fastest way to see whether a core is growing or falling apart. How the timeline works.
Shapes tell you the storm type
You’ll get surprisingly far just recognizing three patterns:
- Discrete cells: separate blobs with tight, intense cores. In a favorable environment these can be supercells, the storms responsible for most significant hail and tornadoes. If one develops a curl or appendage on its flank, read Hook Echoes & Tornado Signatures.
- Squall lines (QLCS): a solid, often bowing line, from a few dozen to hundreds of miles long (Squall Lines, Bow Echoes & Derechos). The main threat is damaging straight-line wind; brief tornadoes can spin up where segments of the line surge forward.
- Stratiform shields: broad, smooth areas of 15 to 35 dBZ. Steady rain or snow, low drama, high accumulation.
Key points
- Reflectivity is logarithmic: every 10 dBZ ≈ 10× more returned energy
- Learn two anchors: ~35 dBZ = heavy rain begins, ~50+ dBZ = a strong core worth a closer look
- Base reflectivity for structure, composite for what’s aloft
- Loops beat frames: motion, trend, and training are the real information
Radar’s one big blind spot is geometry. It measures along a beam that rises with distance, so far-off weather gets sampled thousands of feet up. Before you trust any of the above at long range, read What Radar Can’t See.
Sources
- NWS JetStream, Doppler radar (how radar works, reflectivity and velocity images)
- NWS Warning Decision Training Division, Radar & Applications Course (base products, dBZ, composite reflectivity)
- NWS Western Region Technical Attachment 01-02, cool-season Z-R and Z-S relationships for the WSR-88D (Z = 75 S²)
- NWS La Crosse, August 7, 2021 Boscobel tornado event summary and damage survey