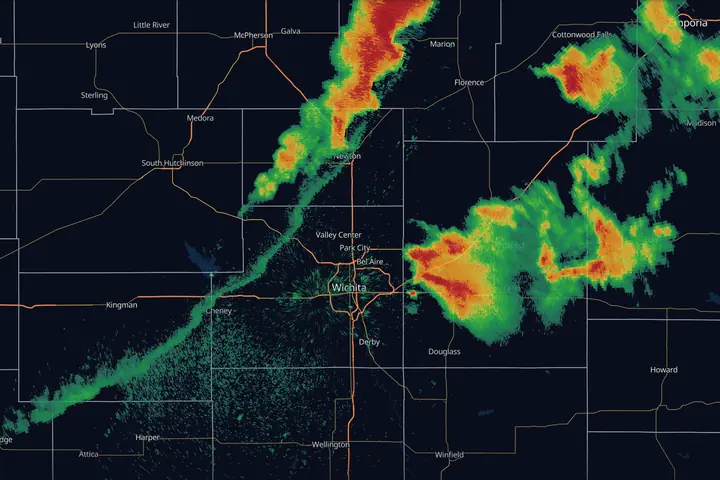
In short: the radar beam leaves the dish tilted slightly upward and the Earth curves away under it, so the farther away a storm is, the higher up the radar is looking: roughly 10,000 feet at 100 miles. Shallow snow, drizzle and low-level rotation far from the radar are simply not sampled. Virga, the bright band, ground clutter and the cone of silence all follow from that one picture.
The single most useful fact about weather radar: the beam is not looking at the ground. It leaves the radar dish angled slightly upward, and the Earth curves away beneath it. The farther a storm is from the radar, the higher the slice you’re seeing.
- 1Lowest tilt, 0.5° above level. The dish cannot look at the ground, only just above it.
- 2Beam center height. Rising with distance and the Earth's curve: about 4,600 ft at 60 mi, 8,200 at 90, 12,700 at 120.
- 3A shallow snow band. Real weather, under the beam, invisible to this radar.
Almost every “the radar is wrong” complaint traces back to this picture.
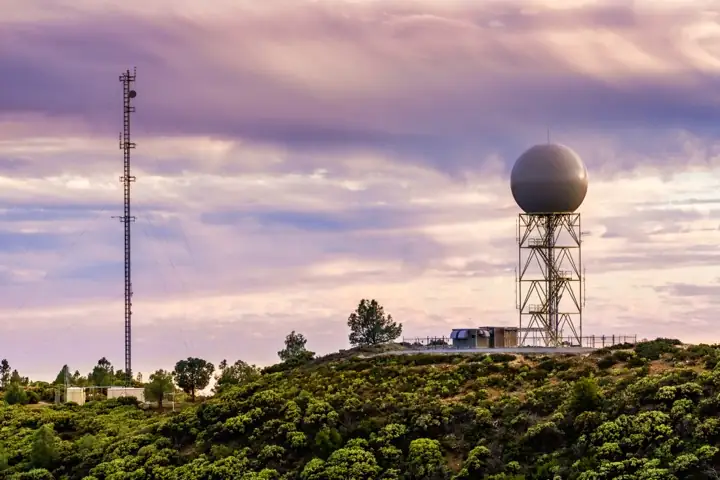
Distance lies
Within 15 miles or so of the radar you are seeing weather under a thousand feet up, close to what is happening at street level. At 100 miles the beam center is about 10,000 ft, at 120 miles about 12,700 ft, and the beam itself is more than a mile deep. Nothing below the bottom of that slab is sampled at all.
Consequences worth memorizing:
- Distant storms look weaker than they are. You’re sampling their mid-levels, well above the intense low-level core.
- Shallow precipitation vanishes at range. Plenty of lake-effect bands and cold-season drizzle top out under 6,000 ft. Past about 75 miles the beam center has climbed above that, and past about 110 miles even the bottom of the beam has. The classic symptom: it’s snowing hard, and radar shows nothing.
- The same storm changes character as it moves. A cell approaching the radar seems to “intensify” partly because the beam slices it lower and lower. Check the trend against neighboring radars before concluding a storm is strengthening.
Which tilt, at what range
Range decides which tilt you should have open.
- Close in, under about 40 miles. The lowest cut is running near the ground and the full depth of the storm is in front of you, so step up through the tilts and read it top to bottom. Three things are worth the climb. A pocket of weak returns aloft with strong returns wrapped around it is an updraft too violent for rain to fall through (BWER). Reflectivity stacked high above the freezing level is hail being held up there. And rotation in the mid-levels is worth finding early, because the question that follows is whether it descends: watch the same tilts in order over the next few scans and see if the couplet shows up lower each time.
- Middle distance, 40 to 80 miles. Structure still reads: cores, notches, the shape of a line. Low-level rotation does not. Stay on the lowest tilt, and retire the word “surface” for anything out here, because that lowest cut has already climbed thousands of feet.
- Past 80 miles. The lowest tilt is the mid-levels. Tilting up buys you nothing you don’t already have, and the only real move left is a different radar.
When no radar covers the low levels of a storm, say so plainly: nobody can see what that storm is doing near the ground. A gap like that argues for more caution, and never for less.
In MesoRadar the tilt selector sits beside the product name on the Local tab, and Slice (Pro, on Level 2 data) draws the vertical cut through every tilt at once, which is the quickest way to see how high the strong echo sits. Where to find them.
Two radars beat one
A radar measures only the part of the motion that runs along its own beam, which is the whole subject of Doppler Velocity. One site gives you one slice through the flow, bent by the angle it was shot from. Bring up a second radar watching the same storm from a noticeably different angle, ideally something near a right angle to the first, and the two views together give a far better picture of the flow.
A second angle also walks you around most of the failures listed in the rest of this guide. An attenuation shadow points away from one particular radar. The cone of silence sits over one particular site. A circulation sampled too high is too high for one particular beam. All three belong to a radar’s geometry rather than to the storm, and a neighboring site comes in from a different direction, through different rain, at a different height over the same cell. Running that comparison across every radar at once is what the national mosaic at the bottom of this page does for you.
When two radars disagree, believe the one shooting through less rain and looking lower.
The cone of silence
Directly over the radar there’s a gap: the dish can’t point straight up. Storms sitting on top of a radar site partially disappear into this cone of silence. If a storm seems to weaken as it passes over a radar site and re-intensifies on the other side, it probably never weakened at all.
Virga: rain that never lands
Radar happily paints precipitation that evaporates on the way down. When the low-level air is dry, you’ll see 20 to 35 dBZ aloft while the ground stays bone-dry. This is virga, and it’s the standard summer-evening false alarm in the High Plains and the Interior West. If the surface dewpoint depression is large, be suspicious of modest returns.
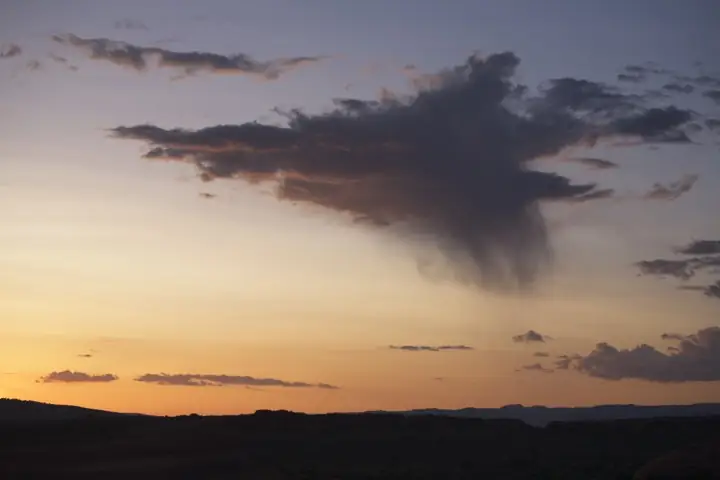
One serious note: dry air under a collapsing storm is also where strong outflow winds and microbursts come from. Virga aloft can still mean wind at the ground.
The bright band
Around the altitude where snow melts into rain, falling snowflakes get coated in liquid water. To the radar, a wet snowflake looks like an enormous raindrop, so returns spike 5 to 15 dBZ in a narrow layer. Where the beam intersects that layer, you get a ring (around the radar) or a stripe of inflated echoes: the bright band. It looks like a band of heavy rain embedded in light rain. Dual-pol gives it away: correlation coefficient sags in the melting layer.
Ground clutter, AP, and other false echoes
- Ground clutter: buildings, terrain, and towers near the radar return energy constantly. Filters remove most of it; a low-dBZ speckle right around the radar site is usually what’s left.
- Anomalous propagation (AP): when a temperature inversion bends the beam down into the ground, terrain far from the radar suddenly “echoes.” AP blobs sit still while weather moves, and they often appear on clear, calm nights. Loop the radar: an echo that holds still under a clear sky is AP.
- Biology: birds leaving roosts at dawn (expanding donuts), bat emergences, insect layers on summer evenings. Often faint, but a fresh roost ring can top 30 dBZ and look exactly like a developing shower. Dual-pol settles it instantly: non-meteorological targets have very low correlation coefficient.
- Attenuation: an intense hail core eats some of the beam’s energy on the way through, so anything directly behind it reads weaker than it really is. The tell is a wedge of low returns pointing directly away from the radar, with its point at the radar site: real gaps in a storm do not line up that way. On NEXRAD’s wavelength this is milder than on the shorter-wavelength terminal radars, but on a squall line the cell shadowed behind the strongest core is the one you are most likely to underrate. Check it from a neighboring radar, and never read a downrange gap as a safe route.
- Beam blockage: mountains, ridges, and sometimes nearby buildings or trees block part of the lowest beam. The result is a permanent wedge, pointing away from the radar, where the lowest tilt shows weaker echo or none at all, while a higher tilt or a neighboring radar shows the weather. It sits in the same place every day, which is how you tell it from a real gap.
- Wind farms: a fixed patch of speckle sitting right on top of the turbine field, sometimes smearing downrange, complete with fake “motion” from spinning blades.
Resolution and update time
A NEXRAD radar physically sweeps the atmosphere, and a full top-to-bottom volume takes 4.5 to 10 minutes depending on which scan pattern the office has selected. The lowest tilt refreshes faster than that: during severe weather the radar squeezes extra 0.5 degree sweeps into the middle of each volume, so base reflectivity lands every two minutes or so while the upper tilts on a tilt selector may be several minutes old. Either way you are looking at the past, and a storm at 50 mph covers four miles in five minutes. Beam width also spreads with distance: at long range, one pixel represents a chunk of sky more than a mile wide, smoothing out small features like tight rotation.
The fix: more radars, blended
Every limitation above is per-radar. The modern answer is MRMS, the NOAA national mosaic. Where one radar’s beam is too high, a neighbor usually fills in. It’s the single biggest upgrade for anyone who lives far from their nearest radar site, and it’s covered in full in MRMS, Explained.
Key points
- Distant and shallow precipitation is undersampled or missed entirely
- Virga paints rain that never lands; the bright band inflates melting snow
- Stationary echoes under a clear night sky are AP or ground clutter
Sources
- NWS JetStream, radar beams: how the beam rises away from the curving Earth, and refraction
- NWS Warning Decision Training Division, Radar & Applications Course (beam geometry, VCPs, SAILS, data quality)
- NWS Radar Operations Center, WSR-88D volume coverage patterns
- Doviak and Zrnić, Doppler Radar and Weather Observations, 2nd ed. (the 4/3 Earth beam-height formula used for the figures here)