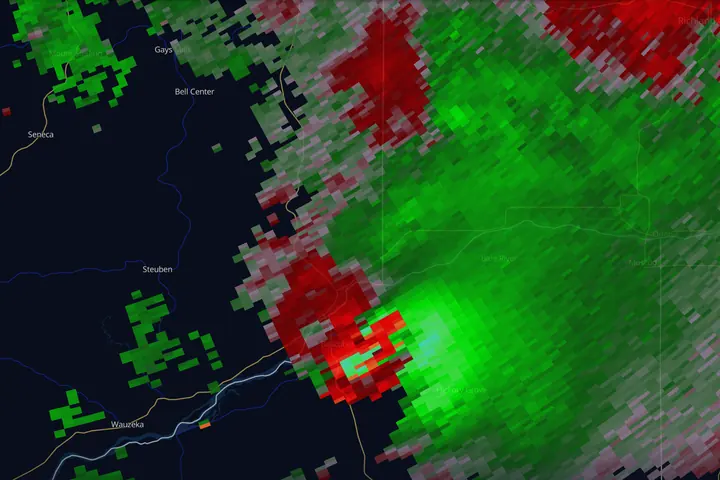
In short: velocity is the radar product that shows wind, measured only along the beam. Green means air moving toward the radar, red means air moving away. Rotation shows as a small green patch touching a small red patch at the same distance from the radar, and storm-relative velocity is the product that makes it stand out.
Velocity tells you how the air inside a storm is moving, and it is how radar detects rotation, often well before a tornado is visible to anyone on the ground.
The physics is the same Doppler effect that changes the pitch of a passing siren. Precipitation moving toward the radar compresses the returned wave slightly; moving away stretches it. From that shift, the radar computes speed.
The one big catch: radial velocity
Radar only measures the component of motion along the beam, directly toward or directly away from the radar site. Wind blowing perpendicular to the beam reads as zero, no matter how strong it is.
This means velocity data is always relative to where the radar sits. The same wind field looks completely different from two different radars, and every velocity signature has to be interpreted with the question: where is the radar from here? Good apps draw the radar site on the map; keep it in your mental picture at all times.
Reading the colors
The convention in the United States and in nearly every app:
- Green (cool colors) = inbound, moving toward the radar
- Red (warm colors) = outbound, moving away from the radar
Brighter shades mean faster motion. The dividing line where colors flip (the zero isodop) is where wind blows perpendicular to the beam. With a uniform wind it is a straight line through the radar; when the wind turns with height it bends into an S, and meteorologists read that bend for how wind changes with height.
These colors are not intensity. Red on velocity is not heavier rain, and green is not calm or safe: a wide patch of bright green can be a damaging wind blowing at the radar. Check the product name before you read a color.
Base velocity vs. storm-relative velocity
Apps typically offer two velocity products:
- Base velocity (BV): raw ground-relative motion. Best for straight-line wind: a huge solid area of 60+ kt inbound on the back of a squall line aimed at your town is the damaging-wind threat. Hold on to two things, though. That number is the wind at beam height, not at your roof, and it counts only the part of the wind pointed at the radar, so a line moving crosswise to the beam reads far weaker than it is.
- Storm-relative velocity (SRM/SRV): the same data with the average storm motion subtracted out. This is the rotation product. A storm moving east at 40 kt can hide a rotation signature inside all that uniform motion; subtract the 40 kt and the spin pops out.
Rule of thumb: BV for wind, SRM for rotation.
Storm motion: the number SRM subtracts
Storm-relative velocity is a subtraction, and something has to get subtracted. Before the product paints a single pixel it takes one storm motion vector, a single speed and direction, and removes it from every measurement in the field. That vector is a choice, made by you or by the software. Choose it well and rotation steps out of the background flow. Choose it badly and a good part of what you are looking at is your own arithmetic, and it looks every bit as convincing either way.
The default is usually an average of everything moving on the screen, and that average goes wrong on precisely the storm you care about. A cyclonic supercell drifts off the mean flow: it tracks to the right of it and travels slower than the crowd. The old forecaster rule of thumb, from Maddox (1976), puts a right-moving supercell about 30 degrees to the right of the mean wind at about three quarters of its speed; the method forecasters use today (Bunkers et al. 2000) gets similar answers in typical setups. The harder a storm rotates, the further it deviates.
Know which motion was subtracted. Some radar programs let you type in your own. MesoRadar’s Storm-Relative Velocity subtracts the average motion of the storms the radar is tracking, and on the Level 2 tier the header names it, for example “moving NNW at 34 kt”. When your storm turns right of the others, that average is off for your storm, so expect the whole storm to lean a little toward inbound or outbound. Judge rotation by the contrast between the two halves of the couplet, not by either color on its own. To find your storm’s own motion, follow one feature across three or four frames, the middle of the core or the tip of an appendage, and compare it with the header.
In MesoRadar: Storm-Relative Velocity on the Level 2 tier subtracts the average motion of the cells the radar itself is tracking, and the line under the product name prints it in your wind unit, such as "moving NNW at 34 kt". When the radar tracks no cells it says "plain velocity, no cells", and on an archived scan "plain velocity in a replay": the picture is then ordinary velocity. The Digital tier is the NWS's own storm-relative product.
Doing it by hand has a second use. The turn is itself a diagnosis: a storm bending right and slowing down is a storm whose rotation is becoming established, and you can catch that on a reflectivity loop before you open velocity at all. A right turn carries the storm off the line you drew, so any arrival time you worked out from the old heading is now pointed at the wrong towns. Redraw the track every few frames.
The couplet: what rotation looks like
Rotation appears as a velocity couplet: a small area of strong inbound directly next to a small area of strong outbound, at the same distance from the radar, side by side across the beam in neighboring azimuths rather than one behind the other down the same radial.
- 1Inbound. Air on this half of the storm is spinning toward the radar. Green.
- 2Outbound. Air on this half is spinning away from the radar. Red.
- 3Counterclockwise rotation. The two halves together are the couplet.
- 4The radar, looking downrange. Swap the radar to the other side and the colors swap too.
What separates weak from serious:
- Broad, moderate couplet: a mesocyclone, the rotating updraft of a supercell. A storm with a persistent meso deserves your full attention, but most mesos never produce a tornado.
- Tight, intense, gate-to-gate couplet: maximum inbound directly adjacent to maximum outbound, in neighboring pixels. Combined with a strengthening trend and a low altitude, this is a tornado-warning-caliber signature (a TVS).
- Distance changes the numbers. The beam widens with range, so the same rotation looks weaker and broader from a radar 100 miles away than from one 30 miles away. Compare a couplet with what the same radar showed earlier, not with a textbook number.
Persistence matters as much as strength. A couplet that holds together scan after scan while tightening is a very different animal from a one-frame flash.
Putting a number on it: Vrot
Forecasters size a couplet with rotational velocity, Vrot: the strongest inbound plus the strongest outbound speed, divided by two, read on the lowest tilt. In SPC’s study of 2009 to 2013 tornadoes, strong tornadoes (EF2 and EF3) mostly came with lowest-tilt Vrot of 40 kt or more, and for Vrot of 60 to 69 kt the chance that the tornado rated EF2 or higher was about 55 to 60%. Those figures describe tornadoes already happening: they say how strong, not whether. Vrot also reads lower far from the radar, where the beam is wide.
Divergence: the microburst signature
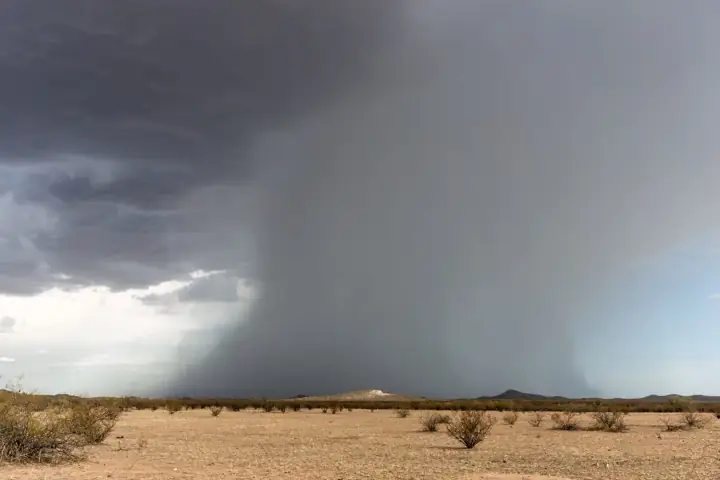
Rotate the couplet 90 degrees and you get a different threat. When maximum outbound sits directly downrange of maximum inbound (colors separating along the beam rather than across it), air is spreading apart at the surface. That’s divergence, the signature of a downburst or microburst hitting the ground and blasting outward. Pilots care about this one more than any other.
Artifacts to expect
- Range folding (RF): areas the radar can’t resolve, usually painted purple or gray. It is missing data.
- Velocity aliasing happens when speeds beyond the radar’s measurable maximum wrap around: a jet of extreme inbound suddenly reads as strong outbound in its core. Modern dealiasing catches most of it, but if you see a nonsensical color flip inside an otherwise smooth field, suspect aliasing before you suspect a 150-kt wind.
- Beam height still applies. A couplet 100 miles out is being sampled around 10,000 ft up. You are seeing mid-level rotation, and what is happening near the ground is uncertain. Everything in What Radar Can’t See applies doubly to velocity.
- A couplet is not a tornado. Even a strong, tight couplet is rotation aloft, at beam height. Radar confirms a tornado only with a debris signature, and only after damage has begun. If you are in a warning, shelter first.
Key points
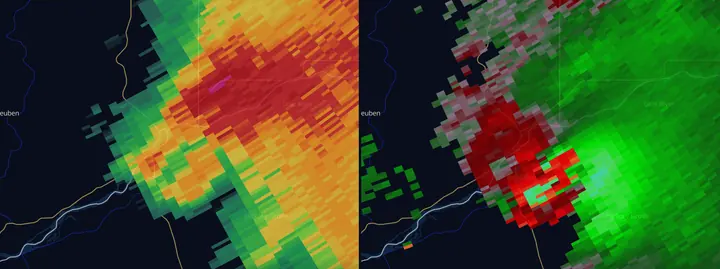
- Radar measures motion along the beam only, so always know where the radar is
- Base velocity for straight-line wind, storm-relative for rotation
- Couplet across the beam = rotation; separation along the beam = divergence
- Tight, persistent, gate-to-gate couplets are the serious ones
Next: put velocity together with reflectivity structure in Hook Echoes & Tornado Signatures.
Sources
- NWS Warning Decision Training Division, Radar & Applications Course (base data interpretation, storm-relative velocity, hodographs and storm motion)
- NWS La Crosse, August 7, 2021 Boscobel tornado event summary and damage survey
- Maddox 1976, the 30R75 rule for right-moving supercell motion (Mon. Wea. Rev.)
- Bunkers et al. 2000, predicting supercell motion using a new hodograph technique (Wea. Forecasting)
- Smith, Thompson, Dean and Marsh 2015, diagnosing the conditional probability of tornado damage rating using environmental and radar attributes (Wea. Forecasting)
- NWS JetStream, Doppler radar and velocity