The manual
Using MesoRadar
Everything the app can do, in the order you are likely to need it. If you are new, read the first two sections and skip the rest until you want them. Every picture here is the real app.
On this page
Your first five minutes
The app is useful the moment it opens, but four small setup steps turn it from a radar picture into something that watches your weather for you.
- Let it find you, or move the map yourself. Allowing
location puts the map on your area and picks the nearest working
radar. On Local, Locate switches to the nearest working radar when
you are more than 60 miles from your current one. A switch in
Settings, Locate picks the nearest radar, turns that off. If you would rather not share location, drag the map to
your area, turn on the radar site dots with the middle button in
the left rail, and tap the site nearest you. There is no address
search; the map is the search.
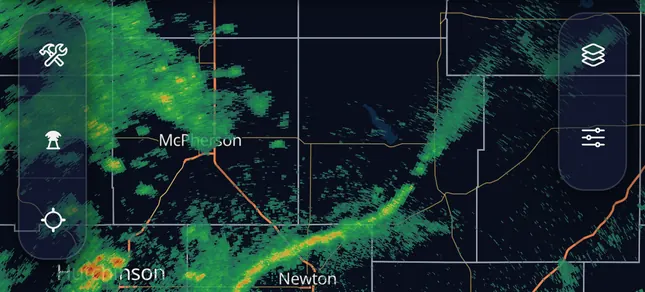 123
Left rail · top left of the map Map tools 1 hold the measuring and reading tools. The radar dish 2 shows or hides the site dots. The crosshair 3 centers the map on you; a second tap adds a cone to your dot showing which way you face, and a third turns it off. - Save the places you care about. Home, the cabin, your parents' house. Saved places live in the Notifications sheet, and they are what notifications are attached to. A place is added from your current location, from wherever the map is looking, or from the area of a warning you are reading.
- Turn on notifications for a saved place. Three
switches have to line up: Dangerous storms on under What to send,
the bell on for that place under Where, and notifications allowed
for the app in your phone's own settings. Miss any one and
nothing arrives.
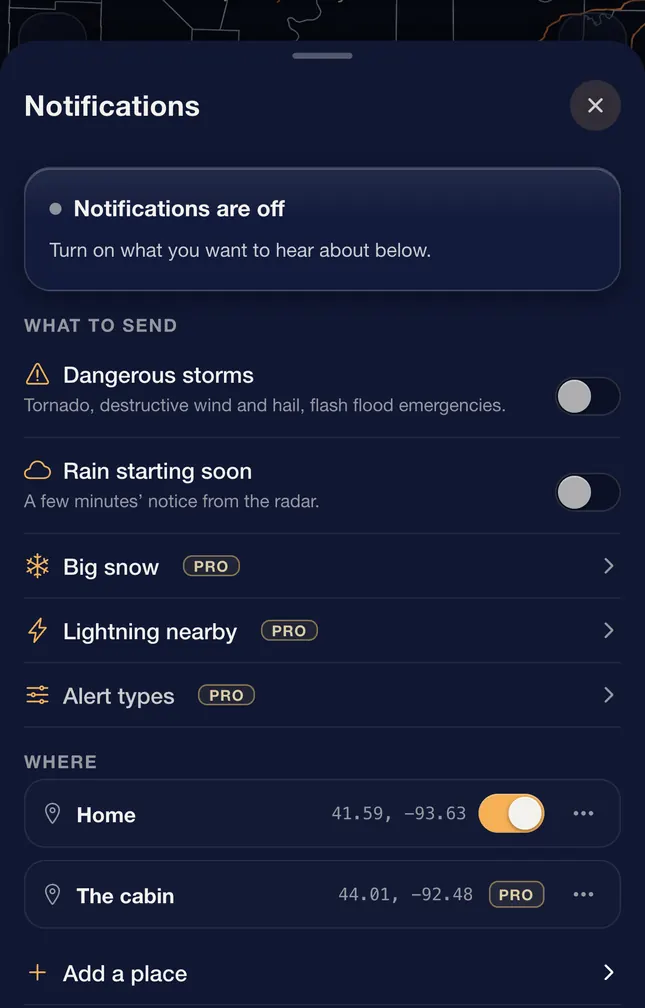 12
Notifications · settings gear › notifications Dangerous storms 1 is the master switch. The bell 2 beside a place is the second. Free warns 3 places; a place past that shows a Pro tag until you upgrade. - Set your units once. Inches or centimeters, miles
per hour or knots, local time or the 24-hour UTC clock forecasters
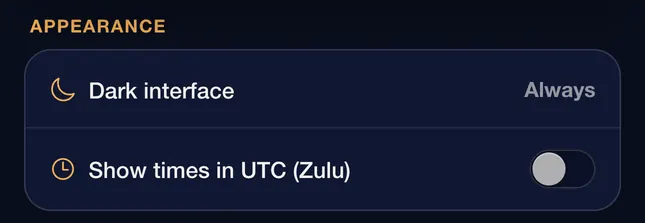
use. Every number in the app follows this setting. The Show times in UTC (Zulu) switch
is under Appearance on the Settings page.
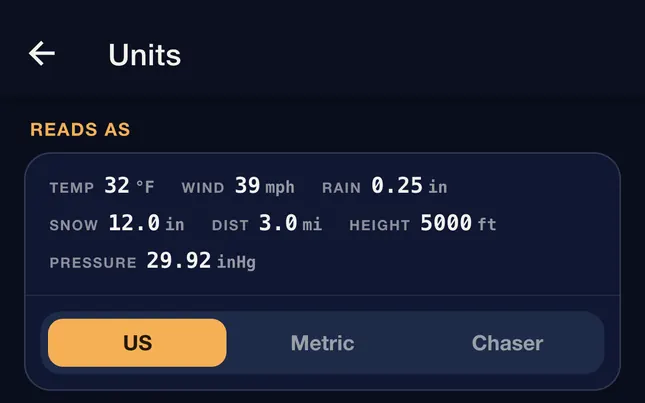 1
Units · settings gear › units Pick a set 1 to change everything at once, or set any single unit below it. Chaser is US units with wind in knots and pressure in millibars, the way radar and surface charts are read.
Worth knowing
Everything in this section is free, including notifications for your first 3 saved places. Being told a tornado warning covers your house should not cost money.
The map and its layers
Most weather apps give you one picture at a time. MesoRadar is built around stacking: radar underneath, warning polygons over it, lightning on top, all moving together on one clock. That is the whole idea of the app, and it is where the interesting reading happens.
Turning things on
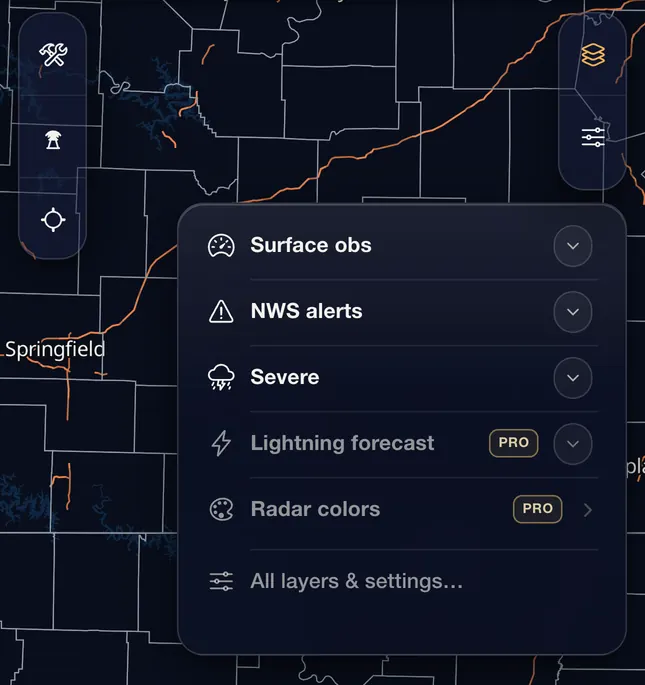
The Layers sheet lists everything available, grouped by what it tells you. The quick menu on the map holds a short list of layers, and the star beside any layer in the sheet adds it to that menu or takes it out. The sheet opens from the quick menu's last row.
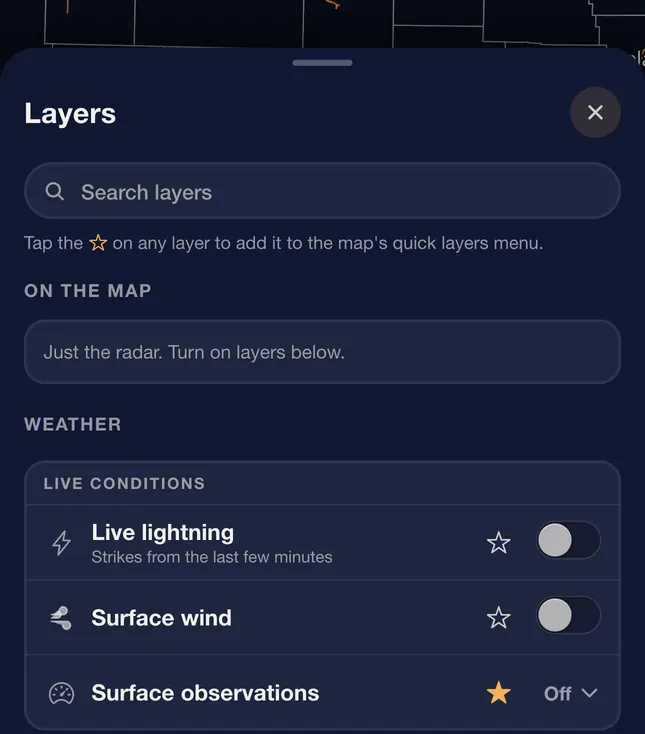 1
The Layers button on the right rail opens the quick menu first, so the layers you reach for most are one tap from the map. The full sheet is the menu's last row.
 1
What is in there
Radar and precipitation
Single-site radar from any NEXRAD (airport terminal radars with Pro), the national mosaic, live lightning, and what type of precipitation is reaching the ground right now.
Hazards and official products
Warnings and watches drawn as the shapes the National Weather Service issued, storm reports from spotters on the ground, Meso discussions, severe, fire and rain outlooks, tropical cones and tracks (the Hurricane tab), wildfires and smoke.
Conditions and forecast
Temperature, dew point, gusts, visibility and cloud cover, one frame per hour; surface wind, surface observations, air quality, winter road conditions (Pro, marked beta because it is an estimate), snow and precipitation forecasts, and future radar on the Forecast tab (six hours).
How many at once
Warnings, lightning, storm reports, wind and the other overlays sit on top of whatever view you have and do not count against anything. What is limited is how many animated layers run under the radar at once: free keeps 1 extra (satellite or surface analysis, say), Pro keeps up to 7, all moving on the radar's clock. Add one too many and the oldest one steps aside.
The timeline
One frame tells you where the rain is. The timeline tells you where it is going, how fast it got there, and whether it is growing on the way.
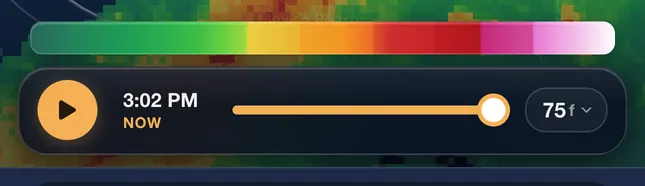
- Play and pause. Pausing on the newest frame keeps
you on the live edge, so new data comes to you as it lands. Pause
anywhere else and you stay put, which is what you want while
studying something.
 123
Playbar · bottom of the map Play 1 runs the loop. The clock 2 is the time of the frame on screen; NOW means the newest one. The dot 3 at the far right is the live edge. The pill sets the loop length. - Drag to scrub. Hold and drag along the timeline to
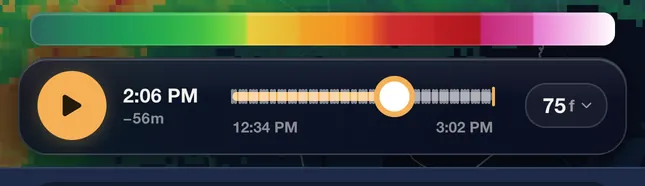
step through frames by hand. This is the fastest way to see whether
a core is growing or falling apart. One thing to know while you
are back in time: warning polygons always show the current set,
they do not rewind with the loop. Storm reports and lightning do.
 1
Playbar · while dragging While your finger is down the bar grows, the clock 1 shows the frame under your finger and how far back it is, and the ends of the track are labeled. Let go and the loop stays on that frame. - Every frame is stamped with the data's own time. The start of the radar's scan for single-site radar, the mosaic's valid time for the national view, the analysis hour for surface fields. It is never the time the frame reached your phone, so you always know how current the picture is.
- Loops fill in newest first. Open a cold loop and the recent frames arrive immediately while older ones fill in behind them. Nothing is broken if the loop is briefly short.
Single-site radar loops run up to 60 frames on any plan. Super-resolution radar shows the newest six frames free and the full loop with Pro. The national mosaic has its own budget because its frames land every two minutes: about 75 frames free, which is roughly two and a half hours of history, and the full 250 with Pro, which is over eight. The other layers run shorter loops that Pro extends.
Choosing a radar view
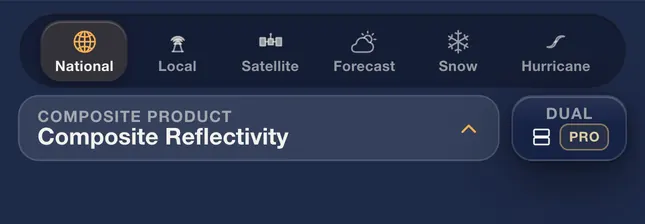
Which radar view you want depends on the question you are asking, and the two questions have different answers. The row of tabs above the product name switches between them.
Where is the weather, everywhere?
The National tab shows NOAA's MRMS mosaic: NOAA blends every radar across the US and southern Canada into one seamless picture that updates every two minutes. It closes the gaps between radars and the blind cone overhead. Where radars are genuinely far apart, mostly across the Mountain West, it gives you the best view anyone has rather than a perfect one. Use it for the regional view and for tracking a system across state lines. Read MRMS, Explained for how the blending works.
 12
The mosaic is not only American. It includes Environment Canada's radars up to 55°N. Canadian radars send a new scan about every six minutes, so over Canada the picture changes every third frame. Hail size, echo tops and VIL also work over southern Canada. Future radar already covers most large southern-Canada cities, Toronto, Montreal, Ottawa, Quebec City, Winnipeg, Calgary and Vancouver among them. Pan north of 55°N, east of Newfoundland, or past the box's western edge out in the Pacific, and a notice says No radar coverage here; warnings, alerts and forecasts keep working, and the loop stops loading until you are back over coverage.
What is this one storm doing?
Single-site radar shows you one radar's own scan, which is where structure lives: hook echoes, inflow notches, velocity couplets. Pick a site, pick a product, pick a tilt. Every product from the standard and super-resolution feeds is free at the lowest tilt, including the dual-polarization products most apps charge for, and the storm-track paths. The higher tilts, Level 2, Slice, the per-cell storm details (hail, rotating storms, strong rotation) and the airport terminal radars are Pro; Map symbols shows each mark. On velocity, green is wind toward the radar and red is wind away; a tight red and green pair side by side, at the same distance from the radar, is rotation, and Doppler Velocity, Explained shows what that looks like.
Three levels of detail
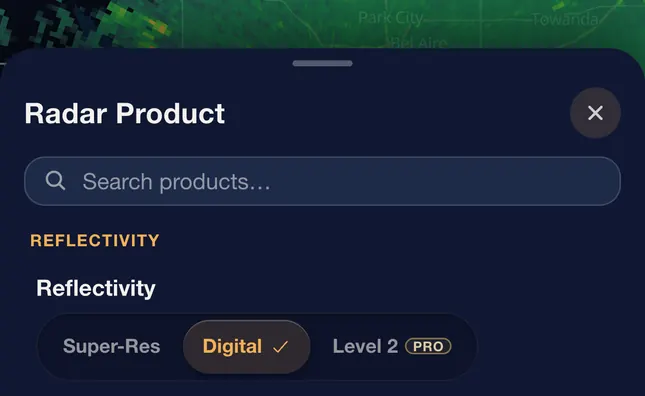
The same reflectivity comes in three grades. The difference is how finely the radar's data is sampled before it reaches you.
- Digital. The lighter product, free with the full 60-frame loop, and enough for almost all reading. One-kilometer bins.
- Super-Res. Four times finer along the beam and twice as fine across it, so small features stay sharp further from the radar. Free shows the newest six frames; Pro shows the full loop.
- Level 2. The radar's own measurements, arriving while the scan is still under way, on every tilt. Decoded on your phone. This is the same data a forecast office works from. Pro.
 1
What the Clear Air and Precip tag means
On a single-site radar the small tag under the product name, such as Precip · VCP 212, says how that radar is scanning right now. The radar runs a fixed scan pattern, called a volume coverage pattern, or VCP, that sets how many tilts it takes and how fast the dish turns. The number is the name of the pattern.
- Precip. The radar is set up for active weather. It turns faster and finishes a full set of tilts in about four to six minutes, so storms update more often.
- Clear Air. The radar turns more slowly to pick up faint echoes, such as light snow or insects. A full set of tilts takes up to about ten minutes, so the picture changes less often.
Worth knowing
Radar looks up, not down. At the lowest tilt the beam is about a mile above the ground 60 miles from the site and nearly two miles up at 100, so far from the radar it can show rain that dries up before landing and miss drizzle or light snow entirely. Beam height beats resolution at long range every time, which is why What Radar Can't See is the more useful guide when a storm is far away.
Hurricane tab
Each active storm with NHC's cone and track, the coastal watch and warning line, and NHC's storm surge map when one is issued (free). The Outlook pill switches NHC's formation outlook between the next 7 days, the next 2 days and off (free); tap an X or an area for its chances. With your location or a saved place, a card says whether it is in the cone, the closest pass and whether damaging winds are possible there (free). With Pro, Wind draws the storm's tropical-storm-force and hurricane-force wind field, and under On the map, Chance of winds and Model tracks add NHC's wind chances and the model tracks. Hurricanes: Structure, the Cone & Model Tracks explains the cone and the tracks.
Reading the satellite colors
Most views on the Satellite tab show the clouds the way your eye would see them, or color the cloud tops by temperature with a scale under the map. Six are false color: Airmass, Day Cloud Phase, Day Convection, Day Land Cloud Fire, Fire Temperature and Night Microphysics. In those, each color stands for a kind of cloud, air or ground, and there is no single number behind a pixel. So the key under the map is a color bar made of solid bands, one band per kind of thing the picture can show, in the order that makes sense for that product. Where two neighboring bands really run into each other, such as cold air into warm air or a moderate updraft into a strong one, the bar blends between them; between unrelated things the edge is hard.
Drag along the bar, or hold a finger on it. A pill names the band under your finger and says what it means in one line. Where something else can look the same color, a second line says so. While your finger is on a band, the map dims every other color and rings each spot of that color, so you can see where that kind of cloud is right now. If none is on screen, the pill says None on screen now. Lift your finger and the map comes back at once. A picture you share from one of these views carries the same bar with each band's name under it.
The band colors are typical midday colors. The real picture shifts with the season and the height of the sun, and on the three Day products (Day Cloud Phase, Day Convection, Day Land Cloud Fire) the colors wash out near sunrise and sunset. When the sun is low over the middle of your map on one of those three, the pill adds Colors fade near sunrise and sunset. For what the colors come from and where they mislead, read Reading Satellite Colors. The meanings follow the NOAA, NASA SPoRT and CIRA GOES-R quick guides; the colors are MesoRadar's own measurements.
Airmass
Airmass shows the air several miles up, not at the ground. It is built from the satellite's water vapor and ozone channels, so it works the same day and night. Use it to see where warm and cold air meet and where a storm system is winding up. The bar runs from cold air, through warm and drier air, to the dry air beside the jet, then the clouds.
- Cold air. A cold air mass, usually behind a cold front.
- Warm air. A warm air mass with plenty of moisture up high.
- Warm, drier air. Warm air with less moisture aloft.
- Dry air aloft. Very dry air sinking from above the weather layer, often along the jet. A tongue of it wrapping into a storm system is a sign the system is strengthening. In summer the same color sits over hot deserts, and there it only means dry air.
- Mid cloud. Cloud in the middle levels, with warmer tops than storms.
- Thick high cloud. Deep, cold cloud tops: storms or the cloud shield of a strong system. Low cloud is not on the bar, because it takes on the color of the air around it.
Day Cloud Phase
Day Cloud Phase tells water cloud from ice cloud in daylight, which is how you watch a field of cumulus turn into storms. The bar runs in growth order: the surfaces first, then water cloud, cloud turning to ice, thick ice, and the two thin kinds at the end.
- Water. Open water with no cloud over it.
- Land. Bare ground with no cloud over it.
- Water cloud. Low cloud made of water droplets.
- Ice cloud or snow. Cloud turning to ice, or snow on the ground. The two share a color; the shape and whether it moves tell them apart.
- Thick ice cloud. Thick, high cloud made of ice: storm tops.
- Thin ice cloud. Thin, high ice cloud.
- Cold mid cloud. Mid cloud of very cold droplets, often mixed with ice.
Day Convection
Day Convection is for picking out new, strong updrafts in daylight. Its bar is in two groups with a gap between them. The left group is the sky that is not a storm. The right group runs by updraft strength, yellow the strongest. A top that slides from yellow toward red is aging; it may still be a strong storm. The storm group gets half the bar because it is the reason to open the product.
- Clear sky or low cloud. Clear ground, or low cloud made of water drops. Both look purple here, and on the frames MesoRadar measured, much of the purple was clear ground.
- Thin high cloud. Thin high ice cloud, or mid cloud. Not a storm top.
- Large ice, high up. A weak or fading storm, or a thick high cloud layer. The color is the same for both.
- Moderate updraft. A cold, tall storm top with small ice.
- Strong updraft. The coldest, tallest storm tops, with small ice. Sun glint, wave clouds or dust can look the same. Check radar. When the part of the Earth that mirrors the sun back at the satellite is in view, which happens near the southern edge of the map (the Gulf and Mexico) on summer afternoons, a dashed line marks that zone while this band is held and the pill says Sun glint likely inside the dashed line.
Day Land Cloud Fire
Day Land Cloud Fire is a near-natural view of the ground in daylight, with fire hot spots forced to red. Use it for smoke, burn scars, snow cover and the fires themselves. Most cloud comes out in shades of cyan; small-droplet water cloud such as fog is gray to dull white. So it is a poor product for telling water cloud from ice cloud.
- Water. Water or flooded ground.
- Bare land. Bare land or dormant plants.
- Vegetation. Growing plants.
- Smoke. Smoke, darker and flatter than low cloud. Dark or dormant land can look the same; check the smoke layer.
- Low cloud. Low or mid-level cloud.
- Ice cloud or snow. High ice cloud, or snow on the ground. Brighter than low cloud.
- Hot fire. A fire hot spot. Only hot fires show at this size: a satellite pixel here is about 2 km across, larger toward the north, and a small or smoldering fire does not fill enough of it to show.
Fire Temperature
Fire Temperature ranks fires by heat. Everything that is not a fire is kept dark so the fires stand out, and the three fire colors at the right end of the bar run cooler to hotter. It works at night: the clouds and the land go black and the fires stay. Cloud hides fires from this product; a fire under cloud does not show.
- Water, snow or night. Water or snow by day; everything but fire at night.
- Clear land. Clear land. Warmer ground looks pinker.
- Water cloud. Cloud made of water droplets.
- Ice cloud. Cloud made of ice.
- Burn scar. Ground that burned recently. Close to the red of a cool fire, and warm bare ground can look the same.
- Fire. A fire. The coolest of the three fire colors.
- Hotter fire. Hotter than the red fire color.
- Hottest fire. A very hot or large fire. The brightest fire color.
Night Microphysics
Night Microphysics is the night-time cloud product, built only from heat channels. Its job is fog and low cloud, which plain infrared cannot separate from the ground. Sunlight spoils it, so use it after dark. The bar runs from the clear ground, up through fog and low cloud, to the thick and thin high clouds.
- Clear. Clear ground. Warmer ground looks bluer.
- Fog or very low cloud. Fog or cloud near the ground. Fog looks duller than low cloud; check surface reports.
- Low cloud. Low cloud in cool air. Fog in cold air looks like this too.
- Mid cloud. Thick cloud in the middle levels, often ahead of a front.
- High thick cloud. High, thick cloud. The coldest tops can show yellow specks.
- Thin cirrus. Very thin, high ice cloud.
Worth knowing
Toward the edge of what the satellite can see, everything drifts blue and purple, even warm air on Airmass. In MesoRadar's frame this shows toward the corners farthest from the satellite: on GOES-East the Pacific Northwest and western Canada, on GOES-West the Northeast, and far out to sea on both. That is the satellite looking through more air at a slant, not a change in the weather.
Reading a number off the map
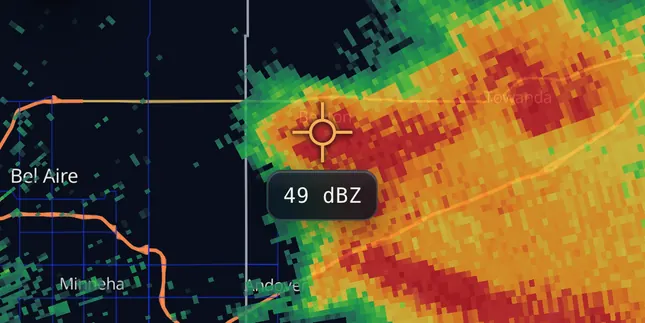
Colors give you the rough read. For the actual value, open the map tools in the left rail and tap Inspect. A crosshair appears on the map; drag the map so the spot you care about sits under it and the value reads out beside it for whatever layer is showing: the actual dBZ, the wind speed, the temperature, the snow total. Satellite pictures have no number to read. As a rough ladder for reflectivity: 20 is light rain, 35 to 45 is heavy rain, and 50 and up is a strong core where hail is worth checking with ZDR. How to Read Weather Radar has the full table.
 12
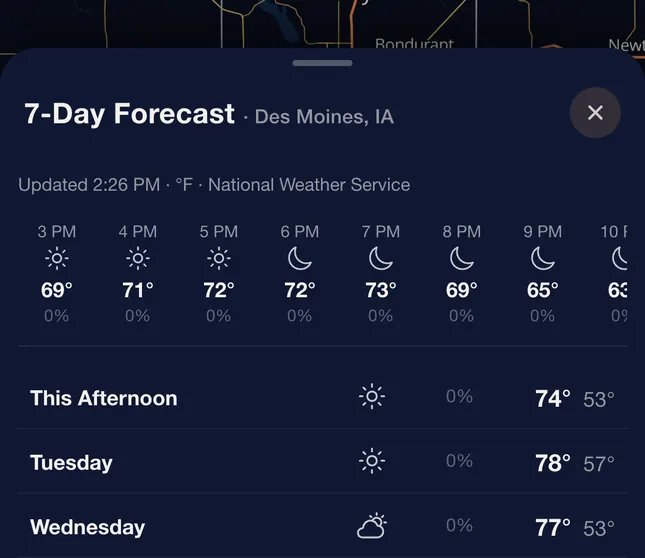
The Forecast button in the same tools opens a seven-day forecast for the place at the center of the map, with the plain-language discussion your local forecast office wrote at the bottom of it. Station observations are their own layer: turn on Surface obs and tap any station. Pro adds the Skew-T tool, which shows the vertical profile of the atmosphere for a point you tap, or the real balloon sounding at an upper-air site. That profile is the picture forecasters use to judge whether storms can form and how strong they can get.
 1
Skew-T: the air above a point
Open the map tools in the left rail and tap Skew-T. Tap anywhere on the map for a HRRR sounding at that point, or tap an amber dot for the observed balloon sounding from that launch site; tap the tool again when you are done. It is a Pro tool. The title reads Sounding for the model and Observed Sounding for a balloon, and the line under it names the source and run. The hour chips step through the forecast, starting at Now.
Beside the chart, the wind half has three views: Hodograph, SR wind (relative to the right mover, with the 0-2, 4-6 and 9-11 km means marked) and 3D, which you can expand and drag to turn. Under them sit the key numbers: Instability, Wind (storm moving to), Composites, and Moisture and levels. A small tag beside a value says what it is: eff for the effective-layer version, fixed for the fixed-layer one, SB for the surface parcel, model where the number comes straight from the model. More opens the rest: Wind by layer (pick layers with Layers, including a custom one), Storm, Effective inflow, Hail, and Lapse rates and levels. The guides How to Read a Skew-T and How to Read a Hodograph explain every number.
Severe-weather ingredients (Pro): the National tab's HRRR Instability, HRRR Shear & Rotation and HRRR Composite Indices groups map the forecast ingredients hour by hour. CAPE & Instability, Explained explains the numbers.
Slice: a storm from the side
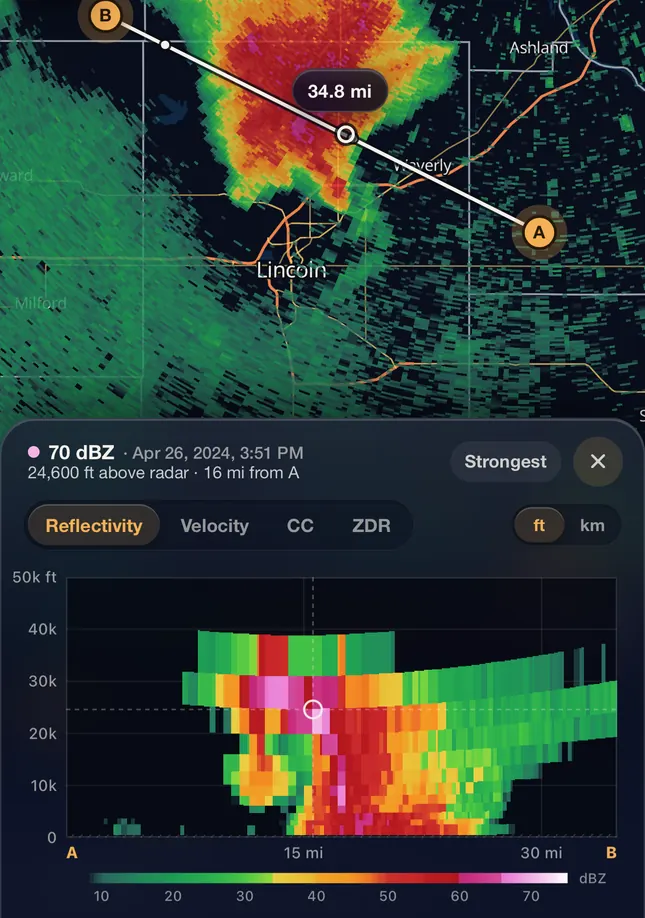
Radar draws a storm from above, one tilt at a time. Slice draws it from the side: a vertical cut through every tilt of the Level 2 scan on screen, along a line you place on the map. That is how you see how tall a core is, how high the heaviest echo sits, and whether the strong reflectivity is still aloft or has reached the ground. It is a Pro tool, on iPhone, iPad and Android phones.
It needs Level 2 on the Local tab: the raw feed is the one the app decodes as a whole scan, every tilt at once. Pick the Level 2 chip in the product picker, open the map tools in the left rail and tap Slice. On any other feed a card says Slice needs Level 2 and offers to switch. A line with two handles, A and B, lands on the map; drag either end across the storm, up to 150 km apart (about 93 miles), and the picture below redraws as you move. Slice works on a single map, so leave dual map first.
 123
The side view runs from A on the left to B on the right. Height goes up the side and is measured above the radar, not above sea level or the ground under the storm. Distance along the bottom is in your distance unit; the ft and km switch changes the height axis only. The fields are Reflectivity, Velocity, CC and ZDR, in the map's own colors, and the time in the header is the scan the cut was made from. Drag across the picture to read along it. Strongest jumps to the biggest echo on Reflectivity, or the fastest wind toward or away from the radar on Velocity; CC and ZDR do not offer it, because their highest values sit on noise.
Two readings mean "nothing here" for different reasons. No echo means a beam looked at that spot and found nothing; a range-folded gate, where the radar could not sort out its return, reads the same way. No beam, drawn as hatching, means no tilt reached that spot at all: below the lowest tilt, in the cone straight above the radar, or past the radar's range.
Warnings and notifications
On the map
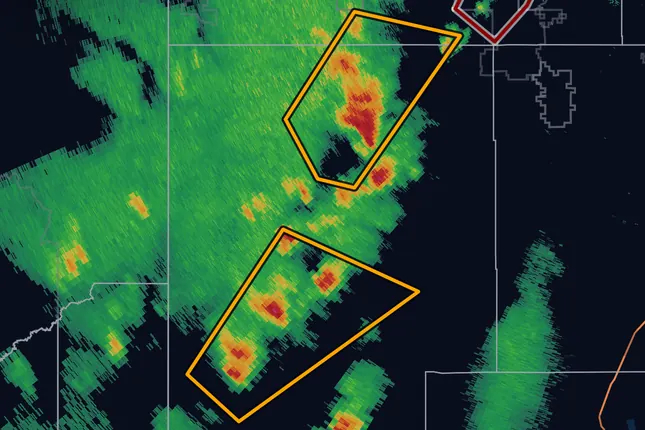
Storm-based warnings (tornado, severe thunderstorm, flash flood, special marine) are drawn as the exact polygon the forecaster drew. That is usually a fraction of a county, and knowing whether the line runs north or south of you is the entire question. Watches and long-fused products like winter storm warnings are issued by county or forecast zone, so those are drawn as the counties or zones they cover, because that is their real shape. Both warnings and watches are free.
On your phone
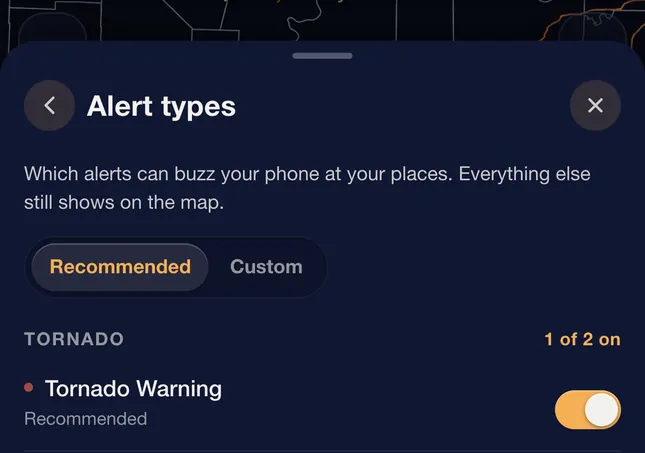
Attach notifications to a saved place and the most dangerous warnings that cover that exact spot get pushed to you: tornado, destructive severe thunderstorm, flash flood emergency, snow squall, extreme wind and dust storm. Free covers 3 places. Pro covers up to 10, and lets you choose exactly which event types are allowed to buzz, so you can add plain severe thunderstorm or flash flood warnings, red flag warnings and winter warnings, and quiet the ones you do not want. The most dangerous warnings arrive with their own sound; every sound follows your phone's silent switch. Tornado warnings, destructive severe thunderstorm warnings, flash flood warnings tagged considerable or catastrophic, snow squall warnings tagged significant, and dust storm, extreme wind, hurricane, storm surge and tsunami warnings also reach the phone as Wireless Emergency Alerts, which sound through silent mode: that is the siren, and the app does not try to replace it.
 1
Why a warning nearby did not notify me
Usually one of four things. The warning was a type the app does not push on your plan (a plain severe thunderstorm warning without the destructive tag, for example), Dangerous storms or that place's bell is off in the app, notifications are blocked for the app in your phone's settings, or the warning polygon genuinely did not cover the exact point you saved. Check them in that order, then look at the polygon on the map.
Quiet hours and overnight alerts
Quiet hours run from 10 PM to 7 AM local time and hold back only the rain-starting-soon and big-snow notices. Warnings are never held back: a tornado warning at 3 AM comes through.
Your phone's own emergency alerts are separate from MesoRadar and fire for tornado warnings, destructive severe thunderstorm warnings, flash flood warnings tagged considerable or catastrophic, snow squall warnings tagged significant, and dust storm, extreme wind, hurricane, storm surge and tsunami warnings. Those reach you either way, and they should stay switched on.
Flooding kills more Americans in a typical year than tornadoes do. On the free plan the app pushes a flash flood warning only when it is a flash flood emergency, a higher bar than your phone's own alerts use. If you sleep somewhere that floods, turn on Flash Flood (all) under Alert types with Pro, or keep a NOAA weather radio by the bed. It is the one channel here that does not depend on a phone.
Map symbols
Every mark the app draws on the map, and what it means. Each picture is cut from the app itself over real weather. Tap a mark on the map for its details. A Pro tag marks the ones that come with Pro.
Storms
All but the last come from the radar's own storm tracking, on the Local tab with Storm tracks turned on; Storm threat is its own layer. The tracks are free; the details on each storm are Pro. None of them is a warning: only the National Weather Service issues those.
-
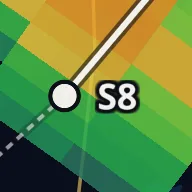 Storm cell
A storm the radar is tracking, with its id. Tap it for its numbers.
-
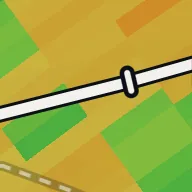 Forecast track
Where the storm will be over the next hour if it keeps the speed and direction it has had. It is a straight line from its past motion, so it does not foresee turns. Each short bar is 15 minutes further on. A storm the radar has only just found has no forecast yet.
-
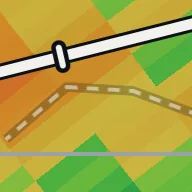 Past track
The faint dashed line is where the storm has been.
-
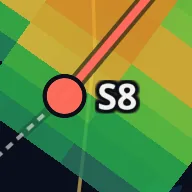 Heading your way
Coral instead of white: the storm's forecast path comes close to your location.
-
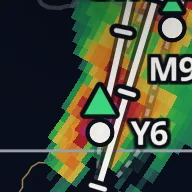 Hail, severe Pro
Large green triangle: a 30 percent or higher chance of severe hail. Filled at 50 percent and up, open below.
-
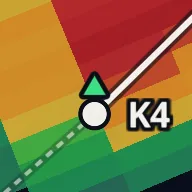 Hail Pro
Small green triangle: a 30 percent or higher chance of any hail, when the chance of severe hail is under 30 percent. Filled at 50 percent and up.
-
 Rotating storm Pro
The radar found rotation in the storm. A thick ring is strength rank 5 or more, the level the radar's own detection calls a mesocyclone, a rotating updraft. A thin ring is weaker rotation.
-
 Strong rotation (TVS) Pro
Strong, tight spin: the wind flips sharply from one radar beam to the next, through at least about a mile of the storm, reaching down to the radar's lowest scans. Far from the radar, even the lowest scan is well above the ground. Not an official warning.
-
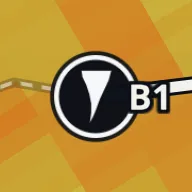 Rotation aloft (ETVS) Pro
The same strong spin, but it starts higher: above the radar's lowest scans and more than about 2,000 feet up. It does not mean the ground is safe. Not an official warning.
-
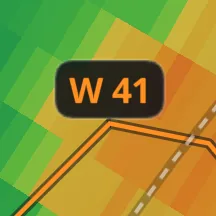 Storm threat Pro
From NOAA's ProbSevere model, not the radar's storm tracking: the chance the storm produces severe weather in the next hour. The outline goes from gray under 30 percent to amber, orange and magenta at 80 and up. The label is the leading hazard and its chance: T, H or W matches that box on the storm's card (T is ProbTor, by the model's own name; H hail, W wind), and S is the chance of any severe weather.
Lightning
Live lightning shows flashes seen from space by the lightning mapper on NOAA's GOES-East satellite; the app checks for new flashes every 30 seconds. It sees all lightning, inside the cloud and to the ground, without telling the two apart, and places each flash to within several miles. It is free.
-
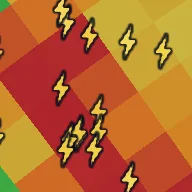 Lightning flash
One flash. It is white for its first 90 seconds, then yellow, then orange as it ages, and it fades and shrinks toward the end of the time window.
-
 The lightning key
The key under the map gives the age of each color.
Storm reports
What spotters, emergency managers and the public reported to the National Weather Service. Reports are preliminary and can be corrected later. Each kind has its own badge, and a bigger badge is a more serious report. The number under a badge is the measurement, such as hail size or a wind gust. A tornado report is a red badge; the white or dark tornado circle on a storm is a radar signature, not a report.
-
 Tornado
A tornado or funnel cloud the NWS has a report of.
-
 Hail
Hail on the ground, with its size.
-
 Wind
A wind gust, measured or estimated, or wind damage.
-
 Flood
Flooding or a flash flood.
-
 Snow
Snow, ice and other winter weather.
-
 Rain
Heavy rain.
-
 Heat
Extreme heat.
-
 Report
Anything else, such as a dust storm or a waterspout.
-
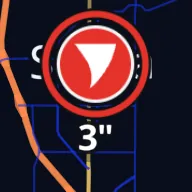 Extreme report
A second ring marks the most serious reports, the ones the card calls Extreme, such as any tornado report, hail 2 inches or larger, or a gust of 75 mph or more.
-
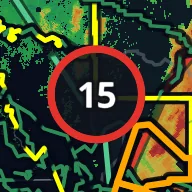 Group of reports
Zoomed out, nearby reports join into one disc with a count. The ring takes the color of the worst kind inside. Zoom in to split it.
Warnings, watches and discussions
Drawn as outlines in the National Weather Service's own colors, with no fill, so the radar under them stays readable. A solid line is a warning and a dashed line is a watch. Advisories, with Pro, use a thin line.
-
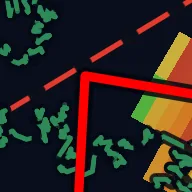 Tornado Warning
Red, the heaviest line on the map.
-
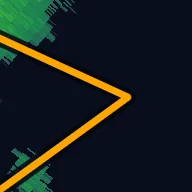 Severe Thunderstorm Warning
Orange. Flash flood, snow squall and extreme wind warnings use the same weight in their own colors.
-
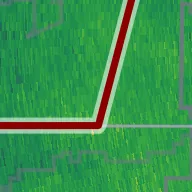 Flash Flood Warning
Dark red. Dark colors get a light edge instead of a dark one, so they still show on the dark map.
-
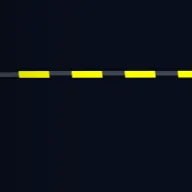 Watch
Dashed, in the watch's color: yellow for a Tornado Watch, pink for a Severe Thunderstorm Watch.
-
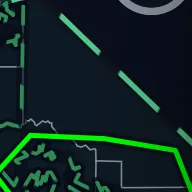 Meso discussion
Longer dashes: a forecaster's short note on the next few hours. The Storm Prediction Center writes them when a watch may be needed and for heavy snow or ice; the Weather Prediction Center writes the heavy rain ones. The color is the topic.
-
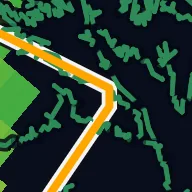 The one you tapped
A white band under the outline marks the warning whose card is open.
Everything else
Reference points, stations and the other layers, each from its own switch in the Layers sheet.
-
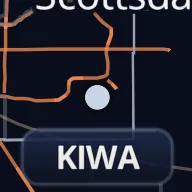 NEXRAD site
A National Weather Service radar. Tap one to switch the Local tab to it.
-
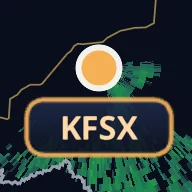 Selected radar
The radar on the Local tab now.
-
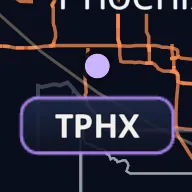 TDWR site Pro
An airport terminal radar.
-
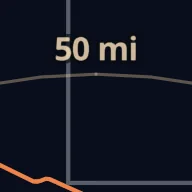 Radar range rings
Distance from the selected radar, in your distance unit.
-
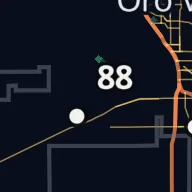 Surface observation
A weather station's latest reading for the field named in the chip at the top of the map, such as air temperature.
-
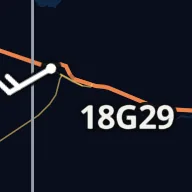 Wind barb
Wind at a station. The barb points to where the wind comes from; the label is the speed, and G marks the gust.
-
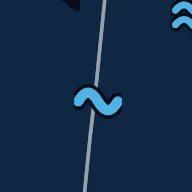 Buoy
An NDBC buoy or coastal station on the Buoys and tides layer, drawn as one wave, with the reading picked in the Layers sheet: wave height, wind, or water temperature. A hollow wave is a reading over 2 hours old.
-
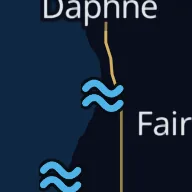 Tide station
A NOAA tide prediction station, drawn as two stacked waves. Tap one for the next high and low tide.
-
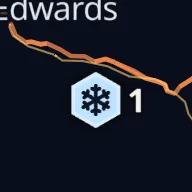 Snow station
A USDA SNOTEL station on the Snow stations layer, with its snow depth. A hollow hexagon is a reading over 3 hours old.
-
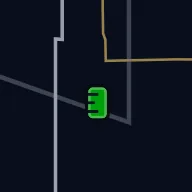 River and coast levels
An NWS gauge, drawn as a staff gauge (the graduated post in the river) and colored by flood stage: green no flooding, yellow action, orange minor, red moderate, purple major, blue no flood stage. A hollow staff is a reading over 2 hours old.
-
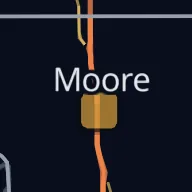 Air quality
An EPA AirNow monitor, a rounded tile colored by its index: green good, gold moderate, orange unhealthy for sensitive groups, red unhealthy, purple very unhealthy, dark red hazardous.
-
 Wildfire
An active wildfire. The bigger the fire, the bigger the flame; a darker red flame is a complex of several fires.
-
 Prescribed burn
A planned burn, drawn as an open amber flame.
-
 Wind farm
One dot per turbine. Turbines can show up on radar as false echoes.
-
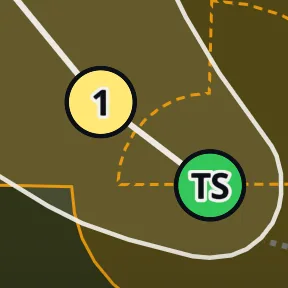 Hurricane cone
On the Hurricane tab: the pale cone is where the center is likely to go; the center stays inside it about two times in three, and rain, wind and surge often reach well outside it. Each dot is a forecast position with its strength (TD for tropical depression, TS for tropical storm, 1 to 5 for hurricane category, L for a low). The shaded wind areas are Pro.
Snow
How much is on the ground, how much fell in the last 24 hours, and forecasts out to five days are free. The forecast rows run to ten days; the 10-day NBM total and the season total carry a Pro tag.
Which of those you are looking at is set from the product row on the Snow tab: what is on the ground and what fell come first, from SNODAS, then the forecast models.
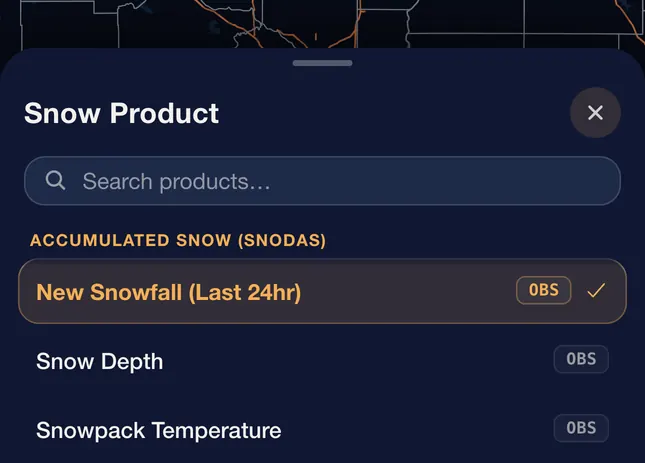
24-Hour Snowfall is the day's rise in snow depth, so snow that settles or melts reads low. The local NWS snowfall reports are the measured totals; Season Total (NOHRSC), in Pro, maps reported snowfall since October 1.
What Pro adds is the not-having-to-check: tell it a number, like four inches, and it tells you when a forecast crosses it for a place you saved.
What you get, and what Pro adds
No ads at any tier. Warnings and watches on the map, the most dangerous warnings as notifications, and the 24-hour snowfall, snow depth and five-day snow forecasts are free. Pro is a monthly or yearly subscription; the current price for your region is shown in the App Store or Google Play before you buy.
Single-site radar
Every standard and super-res product at the lowest tilt, every NEXRAD site
Every tilt, full super-res loops, raw Level 2 with Slice (iPhone, iPad and Android), airport terminal radars
National radar mosaic
Smooth 2-minute mosaic, about 75 frames back
The full 250-frame loop, plus your own color tables
Snow
Depth on the ground, the last 24 hours, and forecast totals out to five days
The season total, the 10-day NBM total, and alerts when a total crosses the number you picked
Warnings and watches
Both, on the map and in the list
Advisories too, and you choose which types buzz your phone
Notifications
The most dangerous warnings for 3 saved places
Up to 10 places, and you pick the warning types
Storm analysis
Storm reports, storm-track paths, live lightning, mesoscale discussions, day-one outlook
Rotation tracks, hail size, rainfall totals, per-cell storm details, Storm threat, soundings
Satellite
Infrared and the full-color view, on short loops
Visible, water vapor and shortwave bands, the long full-color loop and the other color views, and long loops
Loop length
Single-site radar 60 frames, mosaic 75
Mosaic 250, super-res 60, longer satellite, surface analysis and raster mosaic loops
Animated layers under the radar
1 extra
Up to 7 extra
Subscriptions are handled by the App Store or Play Store, so cancelling and refunds go through your phone's account settings. If Pro does not show up after a reinstall or a new phone, use Restore Purchases on the upgrade screen.
When something looks wrong
A product takes a few seconds to appear
Satellite and some of the less common products are built the first time somebody looks at that moment, rather than being kept ready for every minute of the day. The first look can take a few extra seconds, and it is quick after that.
The loop pauses, skips, or is shorter than before
The loop rebuilds from the newest data each time you open it. If a frame is still being prepared, playback can pause briefly and then fill back in on its own, usually within a few seconds. If it lasts longer, switch products and back, or tap the time in the header when it shows a status such as reconnecting.
Everything runs a few minutes behind real time
Radar and satellite take a few minutes to travel from the National Weather Service and NOAA to any app, MesoRadar included. Surface analysis and model fields are published an hour or two after their valid time, and the header says "latest available" beside the time when you are on the newest frame of one of those. The timestamp on each frame is the data's own time, so you can always tell how current the picture is.
A layer will not turn on
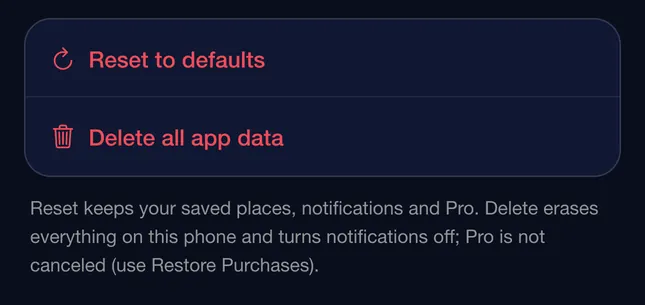
Toggle it off and on, or switch products and back. If that does not do it, check your connection, then try Reset to defaults in settings, which restores map, layer, unit and appearance settings, including any custom color tables, without touching your saved places, notifications, or Pro status.
 1
Times are showing as something like 18:32Z
That is UTC, the single clock meteorologists use so that data from different time zones lines up. It is optional. Switch it off in settings to see your local time instead.
 1
Does it work without a connection?
The data is live, so a connection is needed to load anything current. If you lose signal mid-session, whatever is already on screen stays visible but stops updating, and it picks back up on its own once you are back online. Frames you had not yet loaded will not appear until then. Saved places, settings and Pro status are not affected.